Share this
by Vicki Toy-Edens on July 15, 2021
In June 2020 at the weekly Protenus all-hands meeting, our CEO Nick Culbertson announced that Protenus was looking for actionable insights to address and eliminate racial and/or gender bias within the company and our products in light of the growing Black Lives Matter movement. In the collective brainstorm that followed this announcement, one suggestion was to evaluate Protenus’ Compliance Analytics Platform to determine if there are any underlying biases in our analytics. We would ask: do the potential compliance violations that we surface equitably represent all demographic segments among hospital employees and patients, or are they biased against some, particularly marginalized, groups?
This question has been asked in a variety of ways since the early days of the company, in internal conversations and, at times, by our customers themselves. Our answers had revolved around two main points. First, our models could not be explicitly biased because we do not feed demographic information into them. In fact, we do not even collect data on many demographic factors, including race. Second, we intentionally design features which are theoretically unbiased. For example, we may ask whether a certain employee’s behavior is unusual compared to the same person’s typical activity over a longer period of time, or compared to other employees with whom they interact. At the same time, we have avoided using features such as employee age or generalized role-based groups.
Until last summer, those answers seemed satisfying enough. However, they were not the same as knowing that our analytics are unbiased.
The company’s announcement gave us the extra push to formalize the Bias Assessment Plan. Within a few days, the data science team sketched out a plan to scrutinize our analytics by slicing our data into different demographic “population segments.” The research was then accepted into the backlog, to be scheduled for delivery like any other research effort.
What are we looking for?
Bias can be unintentionally introduced to an Artificial Intelligence (AI) solution in two main ways; (1) the data used for training a model can be inherently imbalanced and/or (2) seemingly objective features may actually be correlated with discriminatory features.
The first case reflects that AI is, in fact, not intelligent, but can only learn from the information it is provided, and that information is often biased. If we were interested in predicting weather for the United States but we only trained our model on data from Arizona and Texas, we could not accurately predict weather in places like Michigan or Washington. However, a model will be not only inaccurate, but harmful, if the input data is biased. Even worse, if a model continually incorporates feedback on its own performance, it can create a positive feedback loop, resulting in a modestly biased input amplifying into a majorly biased output. In an example detailed by The Guardian, a crime prediction tool routed police officers to neighborhoods deemed crime “hotspots” based on past data. A larger police presence resulted in more arrests in the same locations (though not necessarily more crime), and this data fed back to the model, making the hotspots even “hotter” and driving up police presence even further.
Our analytics incorporate feedback on how customers resolved the cases we create: as a true compliance or policy violation, or as a false positive. This is a place in our system where we could unintentionally introduce or reinforce bias. One concern we had was whether cases involving doctors might be less likely to be resolved as violations due to their position in the healthcare hierarchy. This could reflect the difficulty of proving a case involving an employee in a powerful position. It might also be a lot more difficult to answer the question “is this activity appropriate for the employee’s job function?” for a physician, who is responsible for many aspects of patient care, versus, say, a technician who is responsible for measuring certain patients’ vitals on a set schedule on a single floor. However, if our algorithm learns that cases on physicians are unlikely to be closed as violations, it will be less likely to surface cases on physicians in the future. That in turn leads to fewer physician cases, which leads to even fewer violations, creating a troubling feedback scenario. We could imagine similar trends might exist among other executive or managerial positions.
However, we do not directly use features such as “this employee is a physician,” so why should we worry about the AI learning about physicians in the first place? Even when not specifically given race, gender, or other common means of discrimination, models are incredibly good at picking up on correlations to those attributes. In an example from Amazon, attempts to create a model for sorting out top job applicants using resume text resulted in gender discriminatory results. While the applicant’s gender was not itself a direct input, the models learned to devalue resumes which included words like “women’s” while favoring verbs which are more correlated with a male engineer’s resume.
A possible scenario of a correlated bias that impacts patients might occur if our Privacy AI learns to surface fewer potential HIPAA violations involving newborn patients. This could happen if there are many false positives involving newborns in our training data simply because the medical record of a newborn is often missing demographic data, like name, when the record is initially created at birth. For our analytics, this could make it difficult to resolve relationships between the newborn patient records and the mother’s patient record to fully capture the clinical context of the access and “explain” why the access occurred. This example also highlights that bias does not only come from humans but could also stem from a range of factors impacting data quality and completeness.
There are many other examples of ethical biases in machine learning, with notable examples in criminal justice and finance. However, these hard lessons apply across all fields. As a Healthcare Compliance Analytics company, we find ourselves in a key position to ensure that healthcare compliance monitoring treats all healthcare workers equally and protects all patient populations equally. Though we have developed our algorithms with ethics in mind, we know based on the examples just discussed that this alone is not a foolproof preventative measure.
Limitations of our approach
In the ideal scenario, we would check for bias across race, sex, age, gender, income, geographic location, and any number of other socioeconomical indicators. However, we do not have access to complete demographic data, most notably neither healthcare employee nor patient race data. We see this as both a positive and a negative. On the positive side, we are assured that we are not using demographic information explicitly in our features if we do not have access to that information. The major downside is that we are unable to fully test our analytics for racial bias.
Working with healthcare data, our working dataset is the direct result of HIPAA’s minimum necessary requirement and requirements we have set forth with our customers. This raises the interesting question of whether data for monitoring bias should be considered “necessary,” or whether it is better to avoid this type of data altogether.
Despite these limitations, we decided to assess our analytics along population segments that we have access to: sex, age, and employee role information. We also considered using zip codes and length of employment, however these measures were ruled out due to difficulty of interpretation (though we would like to revisit this idea in the future), and unreliability of data, respectively. Our use of employee roles is based on the assumption that employee roles serve as a proxy for inherent hierarchical structures in healthcare which are also strongly correlated with socio-economic differences. Although this is admittedly an imperfect measure, we are optimistic that it is sufficient to rule out egregious bias in our analytics.
Plan
Our AI creates cases on hospital employees for potentially non-compliant behavior related to patient Privacy or Diversion of controlled substances. If our system is behaving fairly, we expect each demographic segment of employees to be flagged by our AI proportional to the underlying distribution of that segment in the entire employee population. Since our Privacy cases also involve patients, we can make a similar assessment about the representation of the patient population.
We collected data on employee age, sex, and role, and patient age and sex across all cases generated over a 6-month period with a sample baseline that included all user and patients with activity in the electronic medical record audit log (for privacy) and all users who handled a controlled substance (for diversion) on a single day.
After analyzing common terms found in role titles, we segmented role information into the following types for analysis: executive/management, providers (including physicians and advanced practitioners), administrators (such as billing/coding specialists, schedulers), clinical (such as nurses), support (such as technicians), and other, based upon role names. Employees with multiple roles were counted in each relevant category.
Our AI looks at all employee activity and determines which activity could potentially be a case, ranking those “potential cases” from most to least likely to be a violation. However, not all potential cases will definitely become cases, depending on the case volumes requested by the customer. Thus, we analyzed both the number of employees that became “potential cases” and the number of “potential cases” that were promoted to cases.
Results
First, we assessed all activity versus activity flagged by our AI as “potential cases”. We calculated the proportion of employees in each employee segment (age, sex, role type) in both potential cases and in overall activity. For privacy cases, we made the same calculations for patient population segments by age and sex. The difference between these proportions was used as Bias Index 1:
BI1 = percent of segment X in potential cases - percent of segment X in overall activity
A difference of 0% indicates that this segment is represented perfectly equally in overall activity as in potential cases. A difference of much greater than 0% means that this employee segment is overrepresented in potential cases.
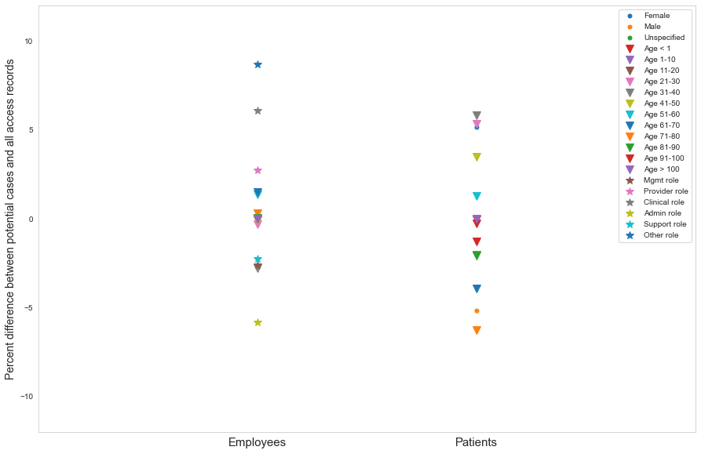
Figure 1. BI1 across employee type segments in Diversion and Privacy potential cases
Across all of our measures, and at overall and more granular case category levels, we found very few instances in which BI1 fell outside the range of -10% to +10%. Since the number of population segments is small, we did not attempt to statistically determine if any one segment was an outlier. However, we saw relatively similar variation in BI1 across different segments and case categories, leading us to conclude that differences of less than 10% are likely indicative of mild to no bias.
By far the largest instance of bias we observed was the overrepresentation of female patients in Privacy accesses in the categories of Coworker Accesses and Self Accesses. In these categories, BI1 was about 26% and 24%, respectively. However, this bias is actually expected given the sex imbalance in healthcare employees which we observed (81% female). With such a high proportion of females in the workforce, it makes sense that an access to one’s own medical record or the record of a coworker would be disproportionately likely to be an access to a female’s medical record relative to the overall patient population, which was roughly balanced. This is also the likely explanation of a smaller (<17% difference), but still noticeable trend in the same two categories for patients in the age range of 20-50 years old.
Next, we assessed potential case activity versus cases. Because we create cases based on our suspicion score, which is the core output of our AI, this assessment is a true test of bias in our AI. For this assessment, we looked at BI1 but also introduced a more simple measure, which was difficult to calculate in the first analysis due to the high volume of total activity. We call this second measure Bias Index 2:
BI2 = Percent of potential cases promoted (segment X) - Mean percent of potential cases promoted (all segments)
BI2 measures how the percent of promoted cases from segment X differs from the mean across all segments. If our suspicion score-based mechanism for case creation is unbiased, we expect BI2 to be close to 0. In fact, we found this to be true (Figure 2). Even when breaking results out by case category, variation in BI2 around 0 was quite small overall and the slight variation that was observed was highly correlated with small sample size within certain segments (e.g. employees with ages >100 years old or less than 20 are associated with very few cases).
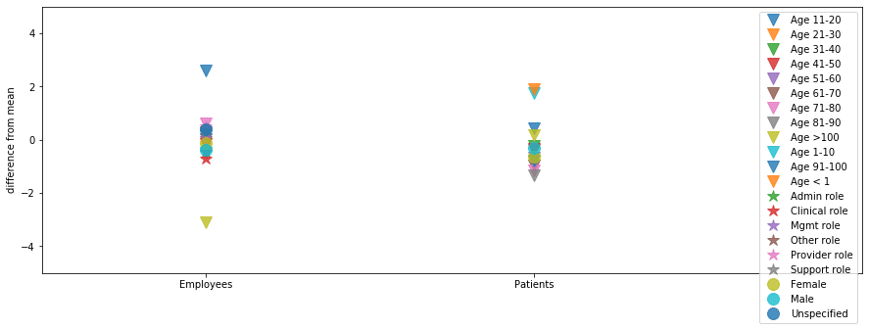
Figure 2. BI2 across patient and employee segments for Diversion and Privacy cases
Encouragingly, we did not see signs of bias in our strongest proxy for marginalized populations, in either overrepresentation of clinical, administrative, support, or other employee type segments, or underrepresentation of providers or management. Thus, the provider scenario discussed earlier does not appear to be a significant issue at the moment. On the other hand, we did find that the very youngest patient population segment was slightly overrepresented in some of our analytics, which lean heavily on patient encounters and clinical context information. This tells us that we need to focus on ensuring that our analytics are robust within each population segment.
Where do we go from here?
As we conclude this research, we feel that we’ve taken a first internal look to affirm that our analytics are not systematically biased according to the measures that we used. At the same time, we are well aware that we must improve our ability to monitor marginalized populations beyond the methods we described here. In the future, this could entail deriving geographic segments from our data, perhaps by revisiting zip code data or other publicly available hospital-level demographic data, even if we are unable to expand our current dataset.
Our job as researchers is to continually evolve and grow our analytics capabilities, so monitoring our analytics for bias can not end with a one-time analysis. We have come to realize that continuous monitoring for bias in our analytics, and improvement in our ability to monitor bias, is as fundamental to our product as any other performance metric that we track.
Why is it important to treat bias monitoring as a fundamental performance measure? We initially planned and described this work as an internally driven research effort. This framing of the work as something internal and relatively invisible to our customers proved difficult to prioritize against direct, customer-facing, feature work. As a small team of data scientists who are responsible for a large number of competing research and engineering goals, it has taken us a full year to fit the entire process of planning, data gathering, analysis, and writing into our team capacity alongside our other obligations. Were it not for strong backing from our executive team and the motivation of the data science team, it could easily have been pushed out quarter to quarter, or year to year, and finally forgotten.
As a quickly growing company, we will always have to balance competing priorities, but in order to ensure that our analytics are equitable and stay equitable, we must make bias monitoring one of our non-negotiables. Our analytics products have serious implications for healthcare employees and patients, and it is our responsibility to ensure that we are not introducing or amplifying bias in the healthcare system through the cases we create. Going forward, we intend to incorporate measures of bias as part of our continuous performance tracking process. We believe that accountability and equity are built into Protenus’ DNA, but we can also ensure that they are built into our code.
Do you want to learn more about the analytics and artificial intelligence underpinning Protenus solutions? Check out other articles on our tech blog.
Share this
Subscribe by email
You May Also Like
The Philosophy of Drug Diversion Programs: Fueling the Next Great Debate
Redefining Privacy: Lessons Learned from over 171M Records Breached in 2023